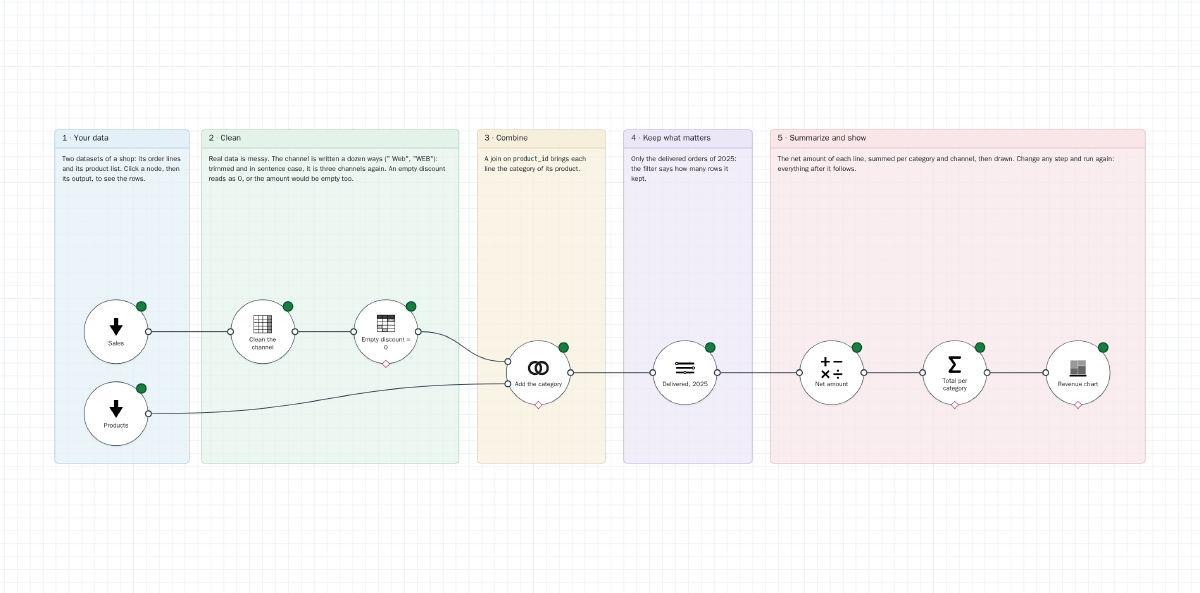
The basic gestures in one flow, step by step on the canvas: clean a messy column, fill a missing value, join two tables, filter, compute, summarize, draw. On a synthetic sales dataset: one invented shop, 2024-2025.
What it contains
- From raw sales to a chart
Try it#
In node.this, on the Projects page, choose Start from an example, then First steps: from raw sales to a chart.
Or download the bundle, first-steps-v0.4.7.zip, and bring it in with Import… on the same page. It was checked against node.this 0.4.7.