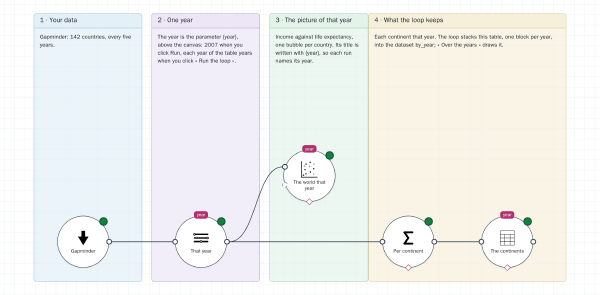
Design a flow for one year, then run it once per year with its loop: a picture and a table each year, a Word document per year, and every year stacked into one table drawn over time. On the Gapminder data: 142 countries, 1952-2007.
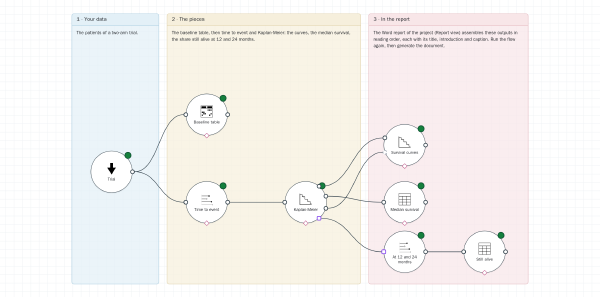
The pieces of a trial’s results in one flow (baseline table, survival curves, median survival, survival at 12 and 24 months) and a Word report that assembles them, each section introduced and captioned. Needs the statistics module. On a small two-arm clinical trial: 90 patients.
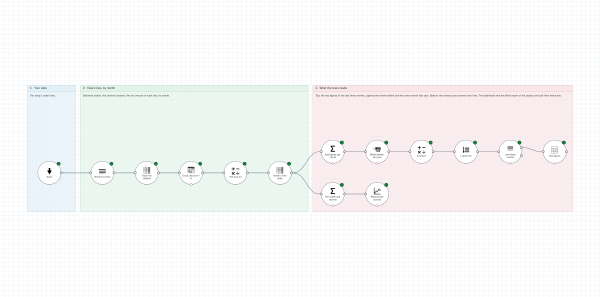
A monthly review that rebuilds itself: the key figures of the last three months and the revenue per channel, with a dashboard and a Word report that follow when the flow runs on next month’s data. On a synthetic sales dataset: one invented shop, 2024-2025.