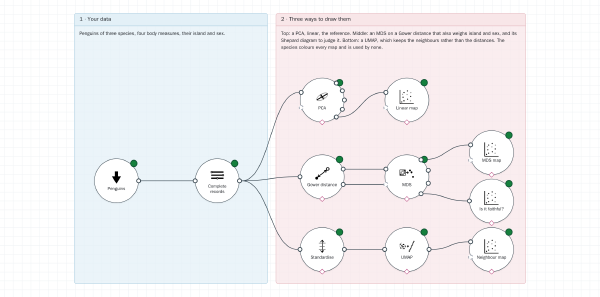
Four measures cannot be drawn: three ways to put the penguins on two axes (PCA, an MDS that also weighs island and sex, UMAP), and how to judge a map. Needs the statistics module and the python-ml environment. On the Palmer penguins (palmerpenguins, CC0): 333 penguins of three species.
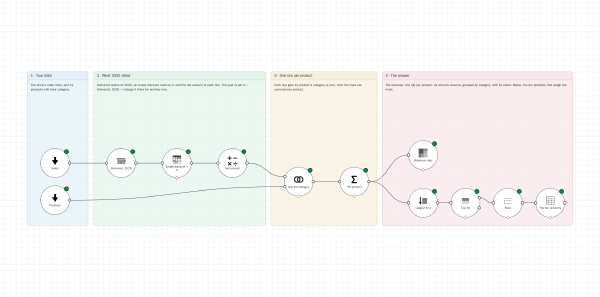
The net revenue of 2025 by category and product: a treemap shows each one’s weight and share at a glance, and the ten products that weigh the most are listed. On a synthetic sales dataset: one invented shop, 2024-2025.
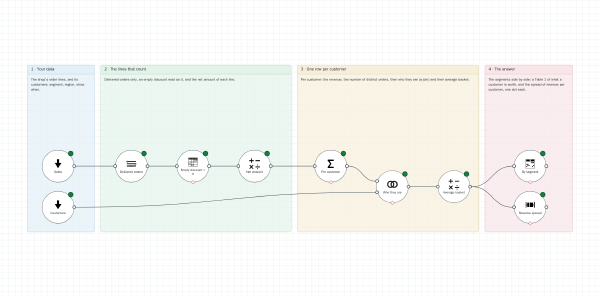
From order lines to one row per customer: orders, revenue, average basket. Then the segments compared, in a Table 1 and one dot per customer. On a synthetic sales dataset: one invented shop, 2024-2025.
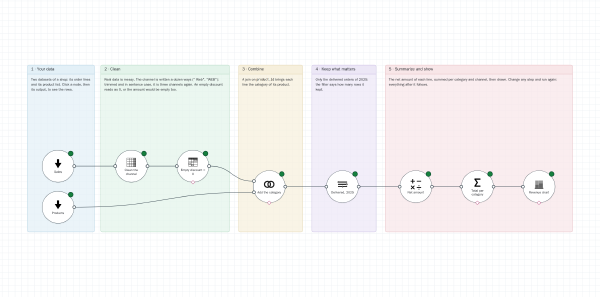
The basic gestures in one flow, step by step on the canvas: clean a messy column, fill a missing value, join two tables, filter, compute, summarize, draw. On a synthetic sales dataset: one invented shop, 2024-2025.