What did the world look like, year by year?
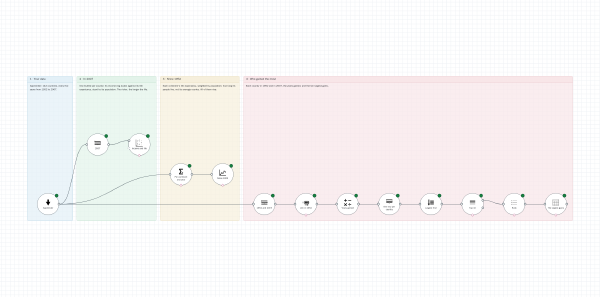
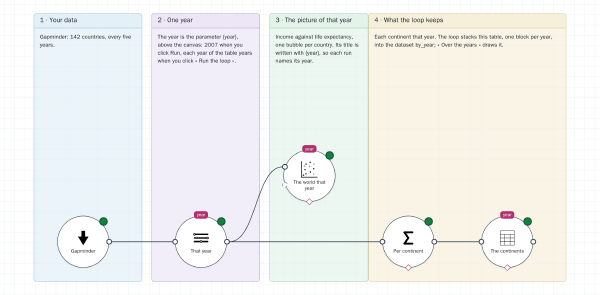
Design a flow for one year, then run it once per year with its loop: a picture and a table each year, a Word document per year, and every year stacked into one table drawn over time. On the Gapminder data: 142 countries, 1952-2007.